Orogen | DNA Science
The only relationship predictions with a methodology published in a science journal and the only probabilities based on data from a peer-reviewed source
The relationship prediction tools at this site are the first to take into account differences between maternal and paternal relationships and show that close genealogical relationships considered to be in the same group are sometimes quite different. And this is the only relationship prediction tool that works for percentages at 23andMe and for cM values in the range of full-siblings at 23andMe.
As of 22 March 2023, it's a violation of the terms and conditions of this site to submit data from any tool on this site (except the one linked to here) to a comparison that expresses now or has ever expressed in the past plans to make either of these two comparisons: (1) The probability that one tool assigns to an individual relationship compared to the probability that another tool assigns to a group of relationship types. (2) A comparison of whether one tool lists the correct individual relationship within the top n possibilities and whether another tool lists the correct relationship group within the top n possibilities, where n is any number. By using this tool you agree to those conditions.
Please enter your shared cMs or % in the applicable box below
Or click here to enter # of segments along with total cMs for much better predictions
The "cMs" input box can be used for Ancestry, FTDNA, and MyHeritage. The methods used at 23andMe are different in that total IBD sharing is used rather than HIR and some segments as low as 5 cMs are included. GEDmatch predictions can be obtained by using the 23andMe cMs box and checking for "HIR."
For the only double cousin relationship predictor, click here. For relationship probabilities that are not weighted by proportion in the population, click here. You might want to use the unweighted predictor if you believe you know how a match fits into your family tree. You would want to stay on the current page if you don't know who your match is. Population weights increase the probabilities for more distant cousins because a person likely has about 5x as many cousins from one generation of ancestors compared to those from the next generation of more recent ancestors.
Please subtract any X-DNA from cM values before using either of the two cM input boxes (labeled "cMs" or "23andMe cMs"). The percentage input box (labeled "23andMe %") is designed for data that include X-DNA.
As of 27 Apr. 2022, this is the first and only relationship predictor with probabilities generated from data that include X-DNA. This is necessary for percentages reported at 23andMe when your match hasn't opted into "Open Sharing" or added you as a connection, in which case you won't be able to see the amount of autosomal only DNA.
In fact, recent discoveries have shown that including X-DNA in the total is better than ignoring the X-DNA amount in relationship predictions.
1C1R = 1st cousin, once removed; cM = centiMorgan; HIR = half-identical regions; IBD = identical by descent (HIR + FIR).
The above probabilities assume no endogamy or other pedigree collapse. Those cases should be treated separately.
*Parent/child and full-sibling relationships are easy to distinguish from each other or any other relationships. Parent/child relationships consist of a half-identical match across the whole length of the genome. Full-siblings share 12.5% fully-identical regions (FIR), on average, while parent/child and half-sibling relationships typically share 0 FIRs. Genotyping sites will take this into account in their relationship predictions. You can generally trust the label "Sibling" at the original testing site if both people have DNA kits there. (They use the term "Sibling" to mean "full-sibling".)
Probabilities are included for relationships as far back as 8C1R. A great advantage of this tool, other than the accuracy of the data, is that it treats close relatives as not being in the same group because the curves are significantly different. For distant relatives, there's much less certainty about the genealogical relationship for your DNA matches. Matches as low as 8 cM are allowed here, however the relationship may be farther back than 8C1R. While the relative probabilities are accurate for the relationship types shown, one also has to consider that the true relationship is a type not listed, such as 9th to 15th cousins. Any of the probabilities shown above are only relative to the other relationships listed, therefore they’re only meaningful in comparison to the other relationships. Not only are very low cM values difficult to assign to a recent ancestor, but segments of 20 cM or 30 cM may be on pile-up regions and therefore come from very distant ancestors.
Totals will not always add up to exactly 100% but will be within a few tenths of a percentage. When more relationship types are possible, the chances of rounding errors increases. For more information about the methodology and discoveries associated with this tool, click here. Or check out the first science article to describe the methodology used for relationship prediction.
The data used for these predictions came from Caballero et al. (2019). In this case, the refined genetic map of Bhérer et al. (2017) was used as well as the crossover interference parameters of Campbell et al. (2015).
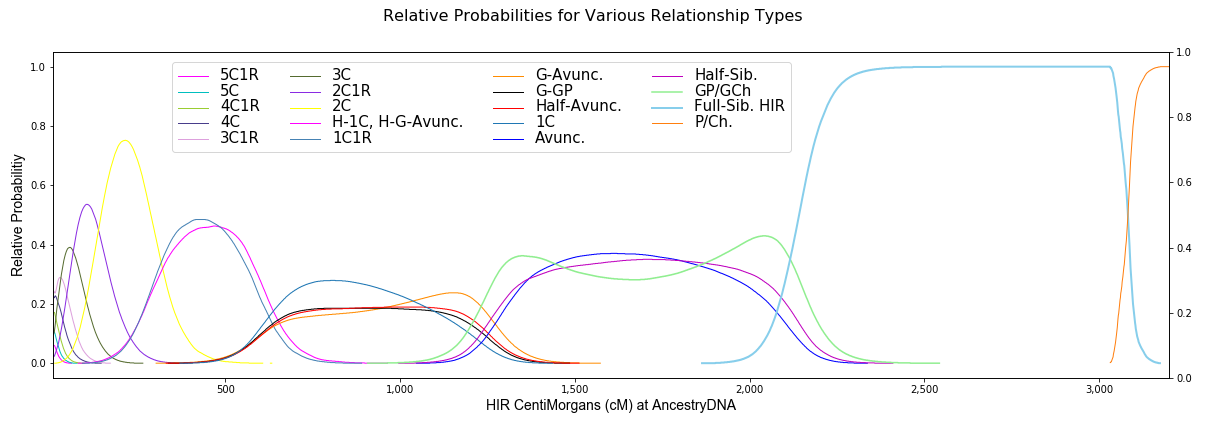
Note that the probability curves in the plot below are very similar to those published here in April, 2021.