
I’ve been brought in to work on several cases in which incest has been suspected and later confirmed in a family.
The first thing I’d like to ask someone when they discover that there’s incest in their family is if they need to talk to someone. People shouldn’t have to navigate those feelings on their own if they don’t want to.
Most of the cases I’m aware of result from a person running the ‘Are Your Parents Related Tool?’ (AYPR) at GEDmatch.com. If there’s a significant number of total centiMorgans (cM) in that result, GEDmatch will provide you to a link for a counselor. I used to think that this was a link to a traditional counselor, but I eventually learned that it only provides contact information for genetic genealogists who have experience with cases like this. While this is helpful, it would also be useful to have a traditional counselor available in the event that a person wants credentialed emotional support, and not just help navigating genetic genealogy.
If you reached this page because of your own family situation, I want to tell you that this isn’t a reflection of you. What anyone did before you were born was obviously out of your control. I’m personally glad that you’ve come into existence, with no strings attached to how that happened. We only have the present and the future to work with.
After talking to a counselor, people are likely going to look for answers. If you don’t have this situation in your own family, consider the situation of someone who does. On top of knowing that, for example, your parents are closely related, imagine how it feels to not know how they’re related.
The AYPR tool at GEDmatch looks for runs of homozygosity (ROH) in a DNA kit and provides the number of cM and percentage that it found. All that is needed is one persons kit. When that person’s paternal and maternal chromosome copies match each other over significantly long stretches, it means that their parents are somehow related, although they could easily be something distant like 5th cousins.
However, if your parents were very closely related, you could look at the tables below to see exactly which ranges your AYPR results fall into.
People who work on incest cases have developed some skills with regard to identifying possible relationships when a new case comes up. This should in no way give them confidence that they have all of the answers or can even arrive at the answer by using very limited datasets and frankly limited experience given the nature of this work. There is no substitute for the tables below. One could work on millions of cases and meticulously compile the data from each, but the resulting dataset would be very flawed compared to the numbers below. Why is that? Working on a case, by its very nature, is a result of not knowing how two parents were related. So one analyzes the numbers and then makes a determination, which is their best guess for a possible relationship that parents have to each other. Only sometimes is this determination able to be subsequently verified through traditional genealogical methods. This also doesn’t rule out additional relationships that may exist. If a dataset is compiled from all of the cases in which a determination was made, then one would get reference points for what ranges of total cM a certain relationship might normally produce. But this is circular. How can data for unknown relationships then be used to determine other unknown relationships? The answer is that it would have to be done very carefully, that it would require thousands of cases, and that all of the data would have to be error-free. This is impossible. What’s necessary is a scientific way of finding out exactly what the averages could be as well as a highly accurate method for determining the ranges. If anyone has worked on a significant number of cases and has compiled data from those, they will see instantly that the numbers below are correct. If they find that they have a data point that falls significantly outside of the range of numbers below, then they have incorrectly identified the relationship for the case they were working on.
I have a model that can calculate the likelihood of different relationships. (A word to those who might not understand this model: Barring simulation user error or misinterpretation of the results afterwards, the averages given by the model cannot be wrong. As for the ranges, since the model is trained to achieve standard deviations from peer-reviewed literature, the ranges will be better than what could be found in empirical datasets, assuming that there ever will be a decent amount of data for some of these scenarios.)
In order to help more people than the ones I’ve worked with, and to help people find answers more quickly, I’ve started providing some statistics that I’ve already compiled. I’m also adding additional scenarios as they come up or as I think of them.
If you’re here because of incest in your own family, I do hope that you’ve gotten and continue to get any support that you you need. Below you will find tables that show what the AYPR results will look like for various scenarios.

Table 1a. Statistics for comparison of one’s own genome to itself, such as can be done with the ‘Are Your Parent’s Related?’ tool at GEDmatch.com. Tables 1a and 1b have been updated with results from the newest, most accurate model available. The other tables will be updated soon.
If you need cM and not percentages, I’m creating separate pages with conversions from percentages to cM already done for each platform. Unless you’ve created a superkit at GEDmatch, it’s better to use the results for the specific site you uploaded from and compare them to the results at the applicable page below:
Remember if you’re looking at your results at the 23andMe website then you’ll need to remove any X-DNA from your results before comparing them to autosomal tables such as these. You’ll have to use cM and subtract any X-DNA from the total cM. I’m only going to include one table here with cM values. That’s Table 1b below, which shows the ROH values in cM only for an AncestryDNA kit uploaded to GEDmatch. For any other cM values, please use the page for the respective platform or convert them from percentage to cM on your own using the values here.

Table 1b.The number of cM that would be reported for a given scenario at the GEDmatch AYPR tool when using a kit uploaded from AncestryDNA.
If you’ve discovered that your father is actually a close relative of your mother, you may not be able to tell exactly how they’re related by looking at the regions over which your chromosomes copies are identical. If your father is a first-order relation to your mother, the averages of those values are the same: You would expect to have about a quarter of your segments identical to each other. You might need to have additional relatives get their DNA tested in order to narrow it down to one of the three scenarios.
Below are some other relationship possibilities that have come up. A person can compare a percentage of shared DNA to a known relative and see if it’s possible based on the tables below. Percentages can also be converted to cM, usually by multiplying by a value in the range 68-72, depending on the total cM for a genotyping site. For GEDmatch, the value is 71.74. However, when converting FIR or ROH percentages to cM, you have to use half of the conversion rate, so 35.87 for GEDmatch. Also please note that X-DNA values, such as what would be reported at 23andMe, must be removed from your data before comparing to the tables below.
The ranges of shared DNA can be very useful. Sometimes there’s a clear distinction between the possible relationships, where one scenario is highly likely and all others are very unlikely. A lot of the time, more than one scenario is probable, but usually one is slightly more probable.

Table 3. Shared percentage of HIR (when not noted), HIR + FIR, or FIR DNA for various relatives when one’s father is also their brother. In cases in which FIR values are present, HIR values can be calculated by subtracting half of the FIR value from the HIR + FIR value. Parents and children always share 50% HIR, so those values aren’t included. The last row is the only scenario in the above table in which oneself is not compared to another relative. This table has been updated with results from the newest, most accurate model available.

Table 4. Shared percentage of HIR (when not noted), HIR + FIR, or FIR DNA for various relatives when one’s parents are siblings to each other. This table has been updated with results from the newest, most accurate model available.

Table 5. Shared percentage of HIR (when not noted), HIR + FIR, or FIR DNA for various relatives when one’s father is also their mother’s father. This table has been updated with results from the newest, most accurate model available.

Table 6. Shared percentage of HIR (when not noted), HIR + FIR, or FIR DNA for various relatives when one’s father is also their mother’s paternal half-brother. This table has been updated with results from the newest, most accurate model available.
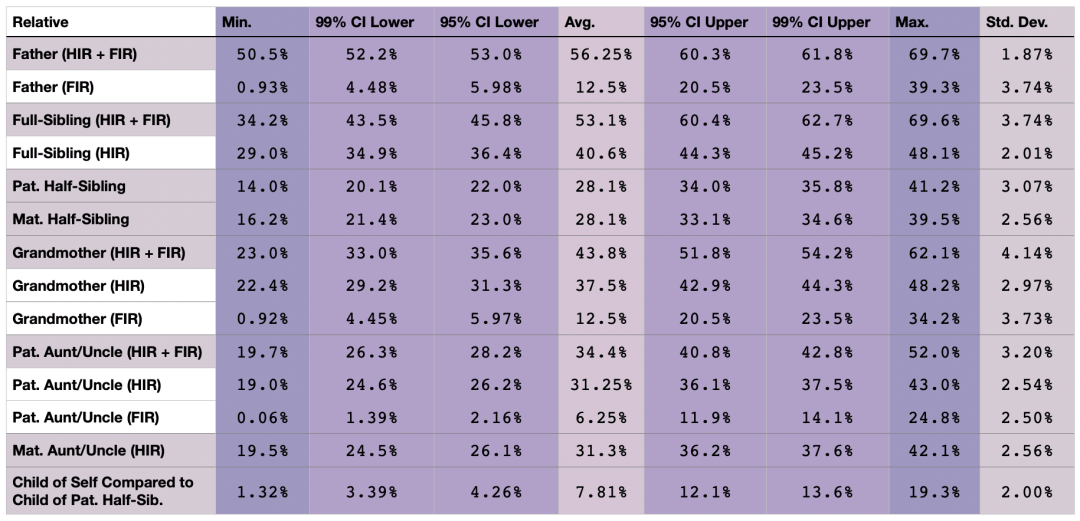
Table 7. Shared percentage of HIR (when not noted), HIR + FIR, or FIR DNA for various relatives when one’s father is also their mother’s maternal half-brother. This table has been updated with results from the newest, most accurate model available.

Table 8. Shared percentages for your 1C1R, whose father’s parents are your maternal uncle and that uncle’s close relative listed in each row. Each simulation consists of 500k trials, which is important for understanding the minimum and maximum values listed. These results are very accurate—the absolute best you could find, but they are not as accurate as the results in Tables 2-5. This is the only table left on this page that hasn’t been updated with results from the newest, most accurate model. All other information is the same as in Tables 2-5.
I hope you’ve found these results useful. More will be on the way.
There’s one other thing I’d like to discuss regarding these numbers. There’s a Facebook group of 160,000 members that might handle the majority of incest cases in the U.S. It would be pretty important for the admins. of that group to have an idea what they’re talking about. However, one in particular apparently doesn’t. In one case, a person asked a question about two full-siblings whose parents were first cousins. They wanted to know if these full-siblings could be expected to share more than 50% DNA, on average. A helpful person responded that that’s true, to which this admin replied, “No they would not. Full siblings will still share in the same range regardless of any additional familial connections.” The helpful commenter tried once to explain that the math dictates that the average must be higher when multiple relationships are present, to which the same admin. responded “I know they wouldn’t share outside the range of full siblings. I do high ROH cases every day. Even siblings who are much more than that, still share in the same range.” This admin. has said the same thing on multiple occasions, usually signing the end of the comment with “-Admin.”, as if to add veracity to the verifiably wrong comments.
In an earlier case a person asked a question about an ancestor pair in the early 1800s who are suspected to be father and daughter to each other. They wanted to know how much DNA that child would share with their father. As you can see in Table 5 above, and as is always the case in first order incest when comparing the child to a parent, the expected value is 62.5%, which one commenter pointed out. The same admin. responded “for a Parent match involving high ROH?” The commenter responded “yes” and explained why, to which the admin. responded “how many high ROH cases have you done with an actual parent testing? I do high ROH cases every day. The parent, even when they are also an additional relationship to the tester, is always just a normal parent shared amount. Example: a recent case I did was 1st degree. The biological parents were full brother/sister. The father/uncle tested a month later and he still only shares [redacted] with the adoptee/tester. The inflation is not on the Parent, it’s on the familial shared matches.” The commenter explained that it was probably on a platform other than 23andMe and thusly only included HIR, which would result in showing only a 50% match. At this time a more experienced admin. likely sent a private message to the loose cannon admin. to inform them they they were incorrect and then they both proceeded to change the subject.
An even more recent example: A person asked about 3/4 siblings, who share more DNA, on average, than half-siblings and less DNA, on average, than full-siblings. A helpful commenter used a known math formula to show that the average shared DNA would be 37.5%. The same admin. then responded “they can share from half-sibling range to full sibling range and anywhere in between. The admin team has done many of these cases and compiled data on them all.” In a separate comment, the same admin. wrote “If [X] and [Y] were to test and they are 3/4 siblings they can share from 1/2 sibling range to Full sibling range and anywhere in between. -Admin.”
Presumable this statement means that 3/4 siblings can share as low as the low end for half-siblings (~17% HIR) and as much as the high end for full-siblings (~43% HIR). But this just isn’t true. Not only do 3/4 siblings have a different range because of sharing an average halfway between those other two relationships, but the range for 3/4 siblings is also narrower than expected because of a greater number of meiosis events being involved. If only using HIR, 3/4 siblings will share about 24% to 38% DNA 99% of the time. These values are very close to the means for half-siblings and full-siblings, in which case half of half-sibling pairs will share too little to be 3/4 siblings and half of full-sibling pairs will share too high to be 3/4 siblings. Those are pretty good odds for distinguishing between the two. Additionally, anyone who doesn’t mention FIR in this case is remiss. All true half-siblings can be ruled out as not 3/4 siblings when looking at FIR, and way more than half of full-siblings can also be ruled out.
It’s ok for a person to be unintelligent. It’s ok for someone to have no concept of basic mathematical principles. It isn’t even any of my business if someone wants to go around “correcting” people who are actually correct. What I find really dangerous about the above comments is that this person claims to work on high ROH cases every single day. That means that this person likely gives wildly incorrect information every day to people who are looking for information about how their parents are related. It would be hard to imagine that this person doesn’t often come to the wrong conclusion when they make a final determination on a case.
Feel free to ask me about modeling & simulation, genetic genealogy, or genealogical research. And make sure to check out these ranges of shared DNA percentages or shared centiMorgans, which are the only published values that match peer-reviewed standard deviations. That model was also used to make a very accurate relationship prediction tool. Or, try a calculator that lets you find the amount of an ancestor’s DNA you have when combining multiple kits. I also have some older articles that are only on Medium.
My parents share the same mother. I recently was contacted by a close relative on 23and me. We are predicted to be 1st cousins (1137cm). No matching on the X chromosome. He was born in 1996 and I was born in 1960. It is unlikely we could be 1st cousins. I am trying to figure out how we are actually related. One possibility I can think of is my grandmothers sisters relatives (ie my great Aunts children’s children). My father is the son of my grandmother and her sisters husband which complicates things even further. Some of the grandchildren of my grandmothers sister and my paternal grandfather have done DNA and come up as first cousins (they are actually 1st cousins once removed) but we share both paternal and maternal because there grandfather is my (paternal) grandfather and their grandmother is my grandmothers sister. I hope I have explained this adequately. Thankyou.
Hi Suzanne,
Are you able to find some DNA matches who only match your father’s father and others who only match your mother’s father? These would be something more distant than a 1st cousin, but other than that the higher cM total the better. If you have any such matches, can you check to see if they match your 1,137 cM match? I’m thinking that that isn’t the case. The most likely scenario is that he’s your half-nephew or great-nephew.
Thanks for such interesting tables.
I don’t have such cases in my family tree but It is interesting.
I wonder if you tried to calculate shared DNA for more generations of incest/inbreeding?
What changes in case of two generations of sib-mating?
Another thing I read on the site https://www.genetic-genealogy.co.uk/Toc115570148.html
It says:
“If only the ancestor is inbred then Σ(1/2)n is an underestimate of the true coefficient of relationship (R) between ancestor and descendant.Σ(1/2)n, which can never exceed 50% unless the descendant is inbred, will be lower than the proportion of genes they hold in common at a particular locus.
Conversely, if only the descendant is inbred then Σ(1/2)n is an overestimate of R.”
Does it correlate with empirical data?
My cousin strongly suspects her father was the result of an incestuous relationship. Her father never knew his father, and anytime my cousin would ask her father, aunt, or grandmother who her grandpa was, they would become very uncomfortable and did not want to talk about it. She believes her aunt and father have the same dad because they look very similar, but we have no way of knowing because neither of them ever knew (publicly at least) who their dad was.
I have since found out that there were rumors about her grandmother’s younger brother, “having his way with her whenever and however he wanted,” but due to some other information, I am wondering if there were multiple family members involved in sexual relationships with her. Also, the age difference is significant, so it seems unlikely that particular brother would be the grandfather (although biologically possible). My cousin has also heard rumors herself that her grandfather was her grandmother’s father.
Is there a way to figure out who the family member could have been without her father’s DNA or her aunt’s DNA? Both her father and grandmother are deceased, and her aunt will not take a DNA test. My cousin has had DNA testing done.
Technically/traditionally?, her father and my father were 1st cousins. Her father’s mother is the fraternal twin of my grandfather. However, I share more DNA with her than I do any of my other cousins who are the children of my dad’s 1st cousins. On 23andMe we have 6.26% (466cM) in common. I share 2-3% with all my other second cousins on the site. Is there any way we can compare our DNA, or I can compare hers to my father’s or one of my father’s uncles (one uncle did a DNA test)?
She has been trying to get help from our mutual family members for years, and while I’m not sure anyone actually knows anything definitively, they’ve all given her the cold shoulder. Something is off about it, and she has some health problems that she is concerned are a result of this and just wants answers for peace of mind.
We would appreciate any help or insight you could offer on this. Thank you for your time. I hope this makes sense.
Thank you for this informative article. I recently worked on a high ROH case and had the misfortune of dealing with the horrible loose cannon admin you mentioned. I’m glad to hear I’m not the only one who finds this admin’s knowledge and behavior unprofessional.